Forex Charts & What You Need
To Know to Understand Them

Understanding forex charts is one of those basic but vital skills that I think everybody ought to know before entering the forex market. Once you have mastered the art of reading and understanding forex trading charts, you will find it so much easier to dabble in some actual trading when the time comes.
Basically there are three types of currency charts:
1. Line charts
2. Bar charts
3. Candlestick charts
Line Charts
If you’ve ever watched the business news on TV you would have seen a line chart for sure. The newscasters show them to indicate the market direction for the day. These are also the most commonly used charts in economic text books.
Line charts give you a pretty good overall picture of how the market moved during a specific period of time. The line is plotted by joining the simultaneous closing prices. With one look at a line chart, you can see the trend for that period of time.
Bar Charts
These types of forex charts show a little more information as compared to line charts. Bar charts give you an overall picture of the opening and closing prices as well as the low and high prices for a specific period of time.
When you look at a bar chart you will see a series of columns. The vertical bar indicates the highest price and the lowest price for that period of time. Each of these vertical bars has a hash marked on its left, which tells you what was the opening price during that period and the hash marked on its right side tells you the closing price.
What you have to remember about bar charts is each chart represents one segment of time. In one chart this could be one hour; in another, this could be for one day and in the third it could be for one month.
If you see a chart described as an OHLC chart, don’t be confused. It is simply a bar chart and OHLC stands for ‘open’, ‘high’, ‘low’ and ‘close’, which is the information the chart indicates.
Candlestick Charts
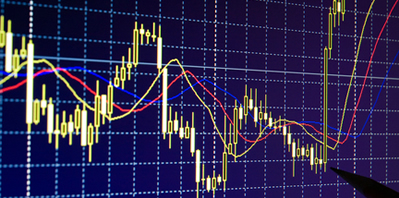
I find candlestick charts particularly interesting. They are also the most commonly used amongst veteran traders as you can see all the information you need at a glance.
The information represented on a candlestick chart is the same as that you would see on a bar chart. The difference lies in the way it is indicated, especially in how the opening and closing prices are shown. In a candlestick chart a graphical format is used to represent the information.
I strongly recommend that you learn how to read all the three types of charts and especially candlestick charts. Understanding what each graph, bar or candlestick represents will help you get a quick grasp of the market trend so you can plan your trading strategy for the day.
If you find something confusing, feel free to contact me I’d be happy to explain it to you. It took me a while to understand these charts fully when I started out but today I can make sense of the chart with a quick glance at it, and I'm sure through time you will be able to do the same. Please also take a look at some of our other related pages below on:
Forex Trading Charts 3 Tips on Using The For Maximum Effect
How To Use Currency Charts to Make Money In Forex Trading
Return to Forex Trading Homepage from Forex Charts


