Forex Alerts, Signals & More Explained
 |
When you engage in forex trading, forex alerts is one of the things you will need to set up. Email or sms alerts are most popular and will keep you aware about the changes in prices. A Forex signal, which is generated by a particular trading system tells you when it is a good time to buy or sell. |
What Are Forex Signals?
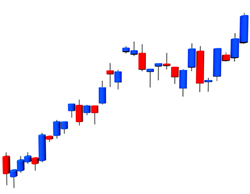
A large number of Forex traders take all their trading clues directly from price behavior, in the manner that it is plotted on the charts. Chart signals indicate when a position can be bought or sold. These signals may be produced by the prices themselves or by certain technical indicators that help in measuring price performance. In some cases, it could be a combination of these two factors.
There Are a Variety of Signals
Stochastic signals- An oscillator is the stochastic indicator. It is plotted right below the price area of the Forex chart. A stochastic line oscillates between 0-100 on a graph. This indicator is very popularly used by traders as it produces very concise buying and selling signals. If the stochastic line oscillates to a point below 20, it is an indication that the price has been oversold. In effect, this creates a buy signal. When that line moves above 80, the price is considered to be overbought and it creates a sell signal.
Moving average cross- This represents the average price of any Forex pair. It is plotted as a single line on the price area on the Forex chart. Most traders use 2 different moving averages. One is slower than the next. This helps in producing sell and buy signals. The popular method is to use the 13-day and the 7-day average. When the 7-day average which is faster, moves over the 13-day average (which is slower), it produces a buy signal. Contrastingly, when the 7-day average moves below the 13-day average, it produces a sell signal.
MCAD Signals- The Moving Average Convergence-Divergence produces buy and sell signals. It is plotted just under the price area on the chart. The MCAD operates almost in the manner that the moving-average cross operates in. This is because it is made up of a fast line and a slow line. When the fast line moves above the slow line, a buy signal is produced. When the fast line moves under the slow line, it produces a sell signal.
Breakout signals- A price breakout takes place when the Forex pair price breaks above a certain price on the Forex chart, that has turned back a minimum of 2-3 times in the recent past. The section where the price has been recently turned back is referred to as “resistance”. If the price breaks above the resistance area, it changes into “support. This is a price area on the Forex chart that is defended by the buyers. A buy signal is created when the price breaks past resistance. Similarly, a sell signal is created when the price moves past support.
The Importance Of Alerts
Time is of utmost importance in the Forex market as there is a lot of volatility and a delay in trading can also mean a monetary loss. This makes it critical for you to receive Forex alerts that are easily accessible as you might not always be tethered to a PC.
You can opt to receive these alerts via sms or email. If the latter is linked to your mobile, you will never miss a Forex signal. These can be set up to match your preferences- when currencies are about to reach a target amount.
So I hope this explains the basics of Forex alerts and signals, if you need further help or advice please contact me


